As organizations increasingly rely on data-driven decision-making, the demand for professionals who can analyze, interpret, and visualize data has grown significantly. Businesses across industries need skilled data analysts who can transform raw data into meaningful insights, helping improve performance, optimize operations, and support strategic decisions.
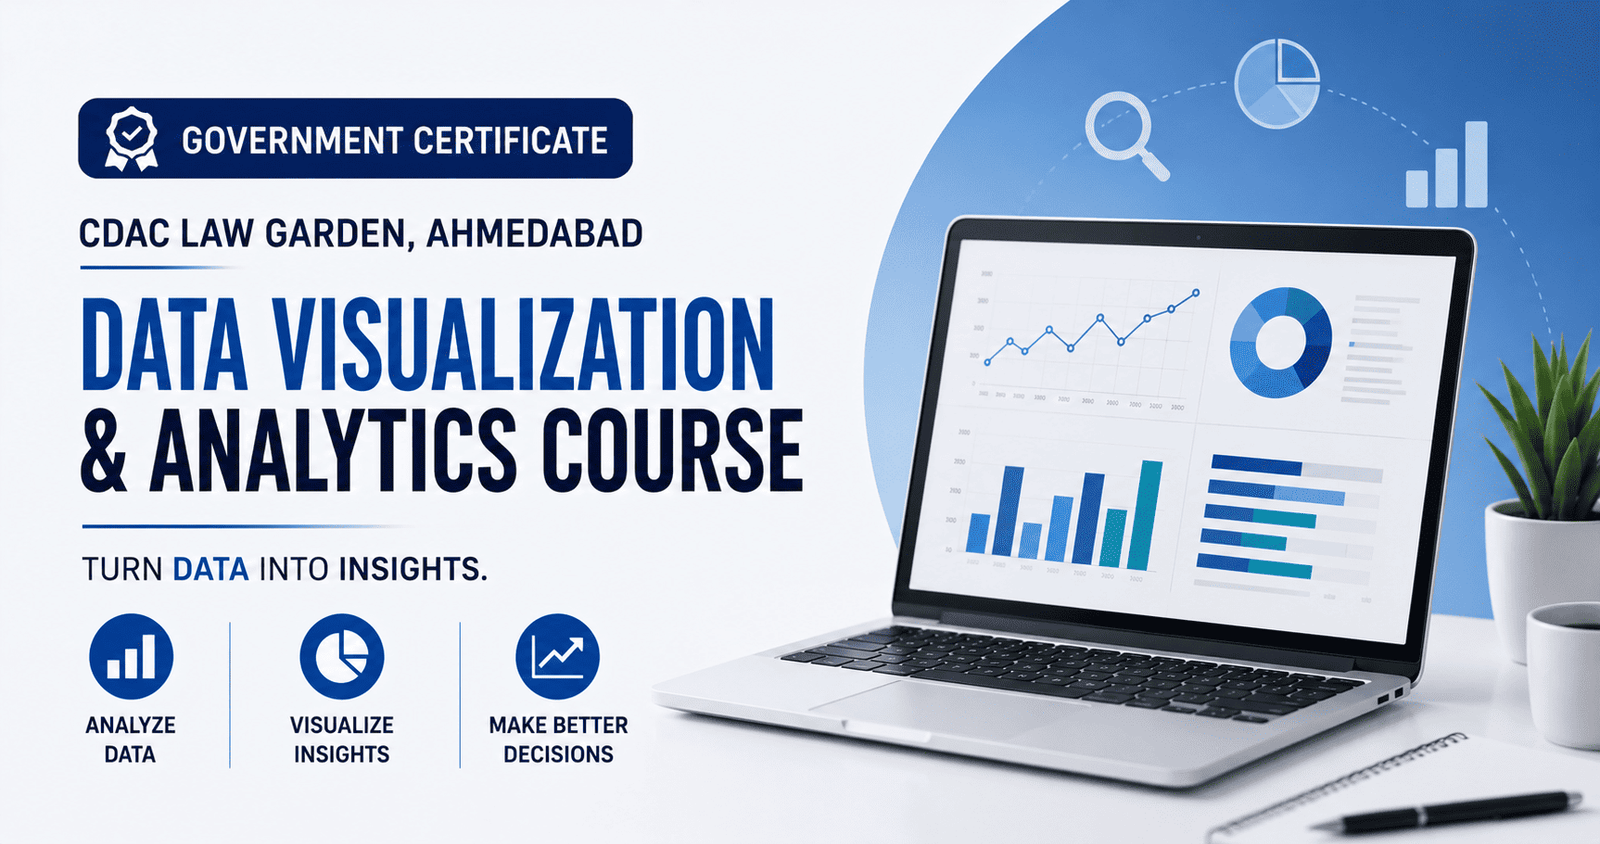
The CDAC Law Garden, Ahmedabad Government Certificate Data Visualization & Analytics Course is designed to prepare students, graduates, and working professionals with practical skills in data analytics, business intelligence, dashboard creation, data visualization, reporting, and analytical thinking. Through hands-on projects, industry-oriented training, and government-recognized certification, learners gain the expertise needed to succeed in one of today’s fastest-growing career fields.
This guide covers course highlights, career opportunities, salary insights, essential skills, industry demand, future scope, and frequently asked questions to help you make an informed career choice in 2026.
CDAC Law Garden, Ahmedabad Government Certificate Data Visualization & Analytics Course: Career Guide & Salary Insights
Data has become one of the world’s most valuable business assets. Every day, companies collect enormous amounts of information related to customers, operations, sales, marketing, finance, and business performance.
However, data only becomes valuable when it is analyzed correctly and presented in an easy-to-understand format.
This is where Data Visualization and Analytics professionals play a crucial role.
The CDAC Law Garden, Ahmedabad Government Certificate Data Visualization & Analytics Course equips learners with practical analytical skills, visualization techniques, and business intelligence knowledge required by modern organizations.
What is Data Visualization & Analytics?
Data Visualization & Analytics is the process of collecting, organizing, analyzing, and presenting data using charts, graphs, dashboards, and reports to support informed business decisions.
It combines analytical thinking with visualization techniques to simplify complex information.
Professionals work with:
- Business data
- Sales reports
- Financial data
- Marketing performance
- Customer insights
- Operational metrics
- Business dashboards
- Performance reports
Their goal is to convert raw data into meaningful business insights.
Why Choose the CDAC Law Garden, Ahmedabad Government Certificate Data Visualization & Analytics Course?
The course is designed to provide practical, industry-oriented training aligned with current business requirements.
Key Benefits
- Government-recognized certificate
- Industry-focused curriculum
- Hands-on practical learning
- Live analytics projects
- Dashboard development
- Portfolio creation
- Experienced faculty
- Career guidance
- Placement assistance
- AI-enabled analytics concepts
Students develop practical skills that employers actively seek across industries.
Who Can Join This Course?
The course is suitable for:
- Students after Class 12
- College students
- Graduates
- Commerce students
- Engineering students
- IT professionals
- Business professionals
- Working professionals
- Entrepreneurs
- Career changers
Beginners with an interest in data and business analysis can also enroll.
Skills You’ll Learn
The course develops analytical, technical, and professional competencies.
Technical Skills
- Data Analysis
- Data Cleaning
- Data Visualization
- Dashboard Development
- Business Intelligence
- Data Interpretation
- Reporting
- Spreadsheet Analysis
- Database Fundamentals
- AI-assisted Data Analysis
Analytical Skills
- Critical Thinking
- Trend Analysis
- Business Reporting
- KPI Analysis
- Decision Support
- Problem Solving
Professional Skills
- Communication
- Presentation
- Project Management
- Business Understanding
- Team Collaboration
- Documentation
Software & Tools You’ll Learn
Students gain practical experience with leading analytics and visualization tools, including:
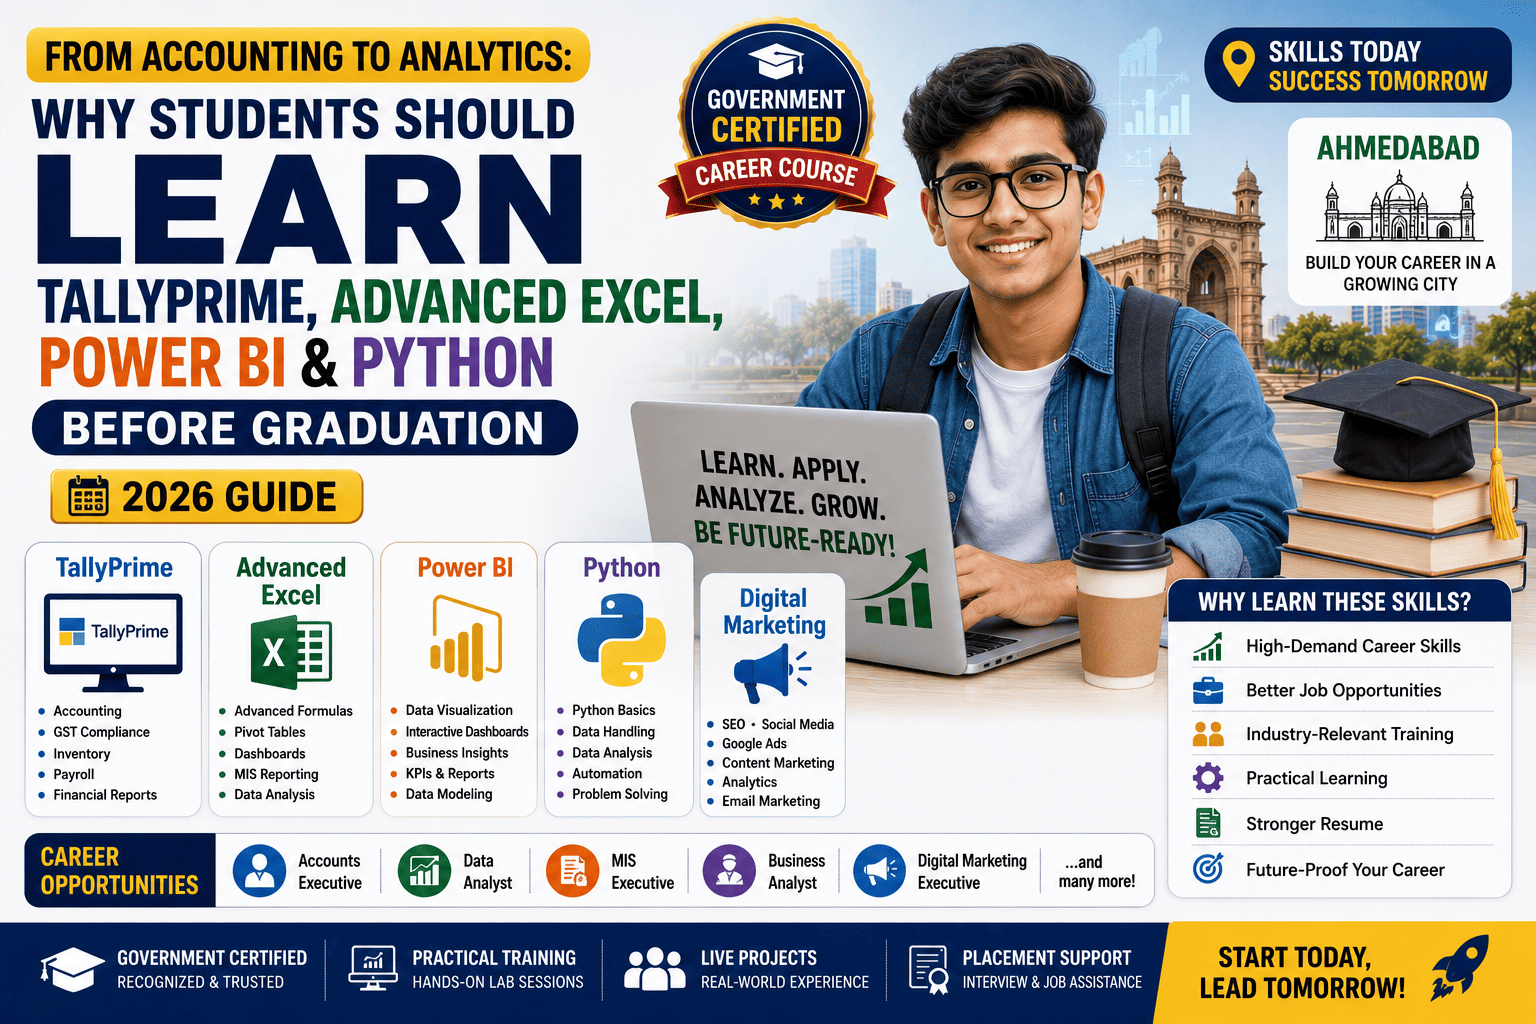
- Microsoft Excel (Advanced)
- Microsoft Power BI
- Tableau
- SQL (Database Fundamentals)
- Google Sheets
- Business Intelligence Platforms
- AI-powered Analytics Tools
Learning multiple tools helps students work effectively across different business environments.
Course Curriculum
A comprehensive Data Visualization & Analytics Course generally includes:
Module 1 – Data Analytics Fundamentals
- Introduction to Data Analytics
- Types of Data
- Business Analytics Concepts
- Data Collection
Module 2 – Advanced Excel
- Data Cleaning
- Formulas & Functions
- Pivot Tables
- Charts
- Data Validation
Module 3 – SQL Fundamentals
- Database Concepts
- Data Retrieval
- Filtering
- Joins
- Queries
Module 4 – Data Visualization
- Dashboard Design
- Interactive Reports
- Charts & Graphs
- KPI Dashboards
Module 5 – Business Intelligence
- Business Reporting
- Data Storytelling
- Performance Monitoring
- Decision Support
Module 6 – AI in Analytics
- AI-assisted Reporting
- Predictive Insights
- Automated Analysis
- Data-driven Decision Making
Module 7 – Live Projects
- Sales Dashboard
- Marketing Analytics
- Financial Reports
- Business Case Studies
- Portfolio Development
Career Opportunities After Completing the Course
Data analytics professionals are required across almost every industry.
Popular career options include:
Data Analyst
Analyzes business data and provides actionable insights.
Business Analyst
Supports organizations by identifying business improvements through data analysis.
Data Visualization Specialist
Designs dashboards and visual reports that simplify business information.
Business Intelligence Analyst
Develops reports and dashboards to support executive decision-making.
Reporting Analyst
Creates automated reports and performance dashboards.
MIS Executive
Manages business information systems and reporting processes.
Operations Analyst
Uses data to improve operational efficiency and business performance.
Data Consultant
Provides analytics solutions to organizations.
Freelance Analytics Professional
Offers dashboard development, reporting, and business intelligence services to clients.
Industries Hiring Data Analytics Professionals
Graduates are recruited across industries such as:
- Information Technology
- Banking & Finance
- Healthcare
- Manufacturing
- Retail
- E-commerce
- Logistics
- Telecommunications
- Education
- Government Organizations
- Consulting Firms
- Startups
As businesses increasingly depend on data-driven strategies, demand continues to grow.
Salary Insights in India (2026)
Salary depends on skills, tools, certifications, and experience.
| Experience | Average Annual Salary |
|---|---|
| Fresher | ₹4–7 LPA |
| 2–5 Years | ₹7–12 LPA |
| Senior Data Analyst | ₹12–20 LPA |
| Business Intelligence Manager | ₹18–30+ LPA |
| Freelancers & Consultants | Income varies based on projects and expertise |
Professionals skilled in dashboards, business intelligence, SQL, and AI-assisted analytics often receive higher compensation.
Industry Demand for Data Analytics Professionals
Organizations increasingly rely on analytics to:
- Improve customer experiences
- Increase profitability
- Reduce operational costs
- Monitor performance
- Forecast trends
- Optimize marketing campaigns
- Support strategic planning
As digital transformation accelerates, data professionals continue to be among the most sought-after talent.
Future Scope of Data Visualization & Analytics
The future of analytics continues to expand with advancements in technology.
Emerging growth areas include:
- Artificial Intelligence
- Business Intelligence
- Predictive Analytics
- Data Science
- Machine Learning Support
- Financial Analytics
- Marketing Analytics
- Healthcare Analytics
- Supply Chain Analytics
- Cloud Analytics
Professionals who continuously develop analytical and visualization skills will enjoy strong long-term career opportunities.
Why Choose CDAC Law Garden, Ahmedabad?
Students choose CDAC Law Garden, Ahmedabad because of its practical learning approach and industry-oriented curriculum.
Key Advantages
- Government Certificate
- Industry-focused curriculum
- Practical training
- Experienced faculty
- Live analytics projects
- Portfolio development
- Career guidance
- Placement assistance
- AI-integrated learning
- Modern analytics tools
The course is designed to make students job-ready for today’s data-driven business environment.
Tips to Build a Successful Career in Data Analytics
To succeed in analytics:
- Practice working with datasets.
- Master dashboard creation.
- Improve Excel and SQL skills.
- Learn business reporting techniques.
- Develop analytical thinking.
- Build a strong project portfolio.
- Stay updated with AI and business intelligence trends.
- Strengthen communication and presentation skills.
- Work on real-world business problems.
- Continue learning new analytics tools.
Frequently Asked Questions (FAQs)
1. What is the CDAC Law Garden, Ahmedabad Government Certificate Data Visualization & Analytics Course?
It is a professional training program that teaches data analysis, dashboard development, business intelligence, reporting, visualization, and AI-assisted analytics while providing a government-recognized certificate.
2. Who can enroll in this course?
Students, graduates, IT professionals, commerce students, business professionals, entrepreneurs, and working professionals can join.
3. Which tools will I learn?
Students typically learn Microsoft Excel (Advanced), Power BI, Tableau, SQL fundamentals, Google Sheets, and AI-powered analytics concepts.
4. Is Data Analytics a good career in 2026?
Yes. Data Analytics remains one of the fastest-growing professions due to increasing demand for data-driven decision-making across industries.
5. What salary can I expect after completing the course?
Freshers generally earn between ₹4 lakh and ₹7 lakh annually. Experienced professionals can earn ₹12 lakh to ₹30 lakh or more depending on skills and specialization.
6. Does the course include practical projects?
Yes. Students work on real-world dashboards, analytics reports, business case studies, and portfolio-building projects to gain practical experience.
7. Can I work as a freelancer after completing the course?
Yes. Many analytics professionals successfully offer dashboard development, business reporting, visualization, and consulting services to businesses worldwide.
8. Why should I choose a Government Certificate Data Visualization & Analytics Course?
A government-recognized certificate enhances your professional credibility while practical training, portfolio development, and industry-oriented skills improve your employability.
Conclusion
The CDAC Law Garden, Ahmedabad Government Certificate Data Visualization & Analytics Course is an excellent choice for students and professionals who want to build a future-ready career in the rapidly growing field of business analytics. With practical training, dashboard development, business intelligence concepts, AI-enabled analytics, live projects, and government-recognized certification, the course equips learners with the skills employers demand.
Whether your goal is to become a Data Analyst, Business Analyst, Reporting Analyst, Business Intelligence Professional, or freelance analytics consultant, mastering data visualization and analytical skills can open the door to exciting career opportunities. As organizations continue making data-driven decisions, professionals with strong analytical capabilities will remain highly valued across industries in 2026 and beyond.